Depth affects the population dynamics on a soft coral?dominated reef on the Great White Wall, Fiji
Depth affects the population dynamics on a soft coral-dominated reef on the Great White Wall, Fiji
Nile P. Stephenson, Katie M. Delahooke, Charlotte G. Kenchington, Jone Waitaiti, Alice A. Ball, Victor E. Bonito, Andrea Manica, & Emily G. Mitchell
Abstract
Soft corals (order Alcyonacea) are an important component of tropical coral reefs, and often form locally abundance dense carpets1. Some soft coral species are prone to bleaching and heat stress like scleractinian, reef-forming corals, but others appear resistant to bleaching stressors2. Despite the importance of soft corals in tropical reefs, there is limited knowledge regarding their demographic ecology3. Spatial point process analysis (SPPA) enables inference of ecological processes underlying spatial distributions of individuals in a community by investigating the fit of models of known processes to observed spatial patterns4. SPPA can also quantify how these underlying ecological processes change with environmental gradients (such as depth)5. We used SPPA to investigate the population ecology on the Great White Wall (GWW), Fiji a vertical reef dominated by Nephtheidae soft corals alongside other filter feeders and algae6. We found that a combination of reproductive and habitat association processes best explained the spatial patterns on the GWW7. We found that the best-fit underlying ecological processes changed with depth, and that Nephtheidae soft corals became more dominant on deeper parts of the wall, likely due to a combination of reproductive lability, fast growth rates, and increasing suitable habitat associated with filter-feeding8888. Even where the Nephtheidae were most dominant, other filter feeders were able to persist9. This mixed community composition could be because the Nephtheidae feed in periods of high current, and temporal niche partitioning in feeding could be permitting biodiversity on the GWW, allowing for hydroids and sponges to coexist with the Nephtheidae10.
Introduction
Tropical coral reefs are major contributors to marine biodiversity and provide economically important ecosystem services, such as reducing wave action and erosion, tsunami protection, ecotourism, and subsistence fishing11. Tropical coral reefs are experiencing dramatic ecological collapses due to anthropogenic climate change (via increased storm frequency, ocean warming, and acidification), destructive fishing techniques, and overharvesting, leading to a decline in hard coral populations, and consequentially, those ecosystem services provided by hard corals12.
A major component of the benthic community within tropical coral reefs are the soft corals (order Alcyonacea)—soft bodied octocorals with an internal skeleton composed of sclerites13. Similarly to hard corals, soft corals are primary consumers, promoting biodiversity via mutualistic benefits to a range of species, produce economically important biocompounds, and support fish biodiversity14141414. In contrast to hard corals, some soft coral taxa, such as those in the family Nephtheidae, retract when not feeding and so do not provide the same coastline protection via disruption of wave action15. However, certain soft coral taxa are resistant to many of the stressors prevalent in the decline of hard coral reefs, such as pollution and sedimentation, temperature-related bleaching, ocean acidification, and storm damage16. This resistance has led to persistence or even dominance of soft corals in some areas where hard corals are declining17. Conversely, some soft coral populations bleach and experience population declines congruent with those of hard corals in response to climate change18.
Some soft coral species have been designated as invasive or range shifters due to rapid substrate colonisation arising from fast growth rates, high competitive capacity through allelopathy, removal via colony migration permitting overgrowth of hard corals, and lability of reproductive mode19. Therefore, soft coral-dominated communities have the potential to be an end point of phase-shifts for tropical coral reefs as hard corals decline due to anthropogenic stressors which soft corals can tolerate20. However, soft coral reefs would likely provide a different set of ecosystem services compared to hard corals21. It is therefore important to understand underlying ecological processes contributing to soft coral demographic ecology in areas where they are dominant in order to inform conservation and management strategies for tropical coral reefs22.
The demographic ecology of sessile organisms can be determined through analyses of the spatial pattern of individuals in a population23. The spatial patterns of organisms within communities reflects underlying ecological processes that have occurred throughout an organisms’ life24. Four sets of processes are known to determine the patterns of sessile organisms: (1) interactions with the environment; (2) reproductive processes; (3) interactions within and between species (e.g., competition, facilitation); and (4) density-dependent mortality processes25. Spatial point process analysis (SPPA) is the analysis of patterns of points (here, each representing a single organism), revealing the most likely ecological processes underpinning the observed spatial pattern26. For instance, reproductive aggregations can be modelled by Thomas cluster (TC) processes, while aggregations due to associations with local habitat heterogeneities by heterogeneous Poisson (HP) processes27. SPPA has been used to reveal mortality processes, habitat interactions, and competition in hard coral communities, as well as density-dependent mortality processes and facilitation in deep-sea soft corals, and reproductive aggregations in gorgonians28. However, SPPA has not, to our knowledge, been applied to tropical soft corals to date29.
Methods
Field site
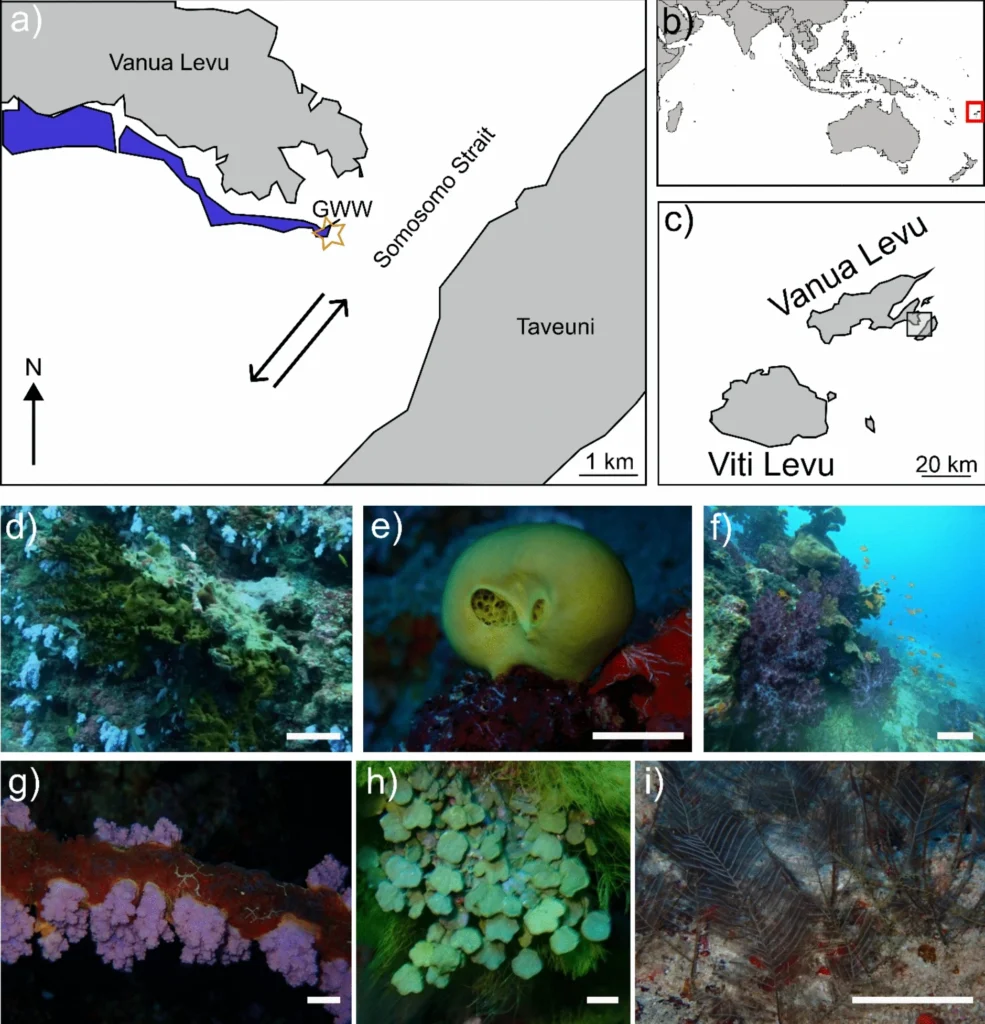
In this study, we focussed on the GWW, a vertical section of a barrier reef in the southwest of the Somosomo Strait which runs between Vanua Levu and Taveuni Islands, Fiji (Fig. 1a), and is dominated by white Nephtheidae soft corals that give the site its name30. The GWW is the ideal site to try to understand soft coral population dynamics because it is a well-known, accessible reef with high densities of soft corals within safe diving limits31. We accessed the site by scuba diving and used video to map between the top of the wall at 17 m to a depth of 33.5 m32. Alongside, the white Nephtheidae soft corals, other abundant morphospecies were a species of colonial hydroid (visually similar to Myriopathes), lemon sponges (Leucetta chagosensis), colourful
Dendronephthya soft corals, algae (possibly Halimeda spp.), and adult Tubastraea sp. (an azooxanthellate hexacoral with a hard skeleton) 33333333. All these morphospecies except the algae are filter feeders34.
Fig. 1: a) Location of the Great White Wall (GWW; orange star). b) zoomed out map of Vanua Levu and Viti Levu islands, Fiji, and c) broader geographical context of Fiji. Arrows in a indicate current direction depending on tides. Blue area indicates barrier reef. d) Tubastraea on the GWW, e) Lemon sponge, f) Dendronephthya, g) white Nephtheidae on the GWW, h) algae, i) hydroid colonies. Scale bars for e, g, h, and i ~1 cm; scale bars for d and f ~10 cm35.
Data collection
We used structure-from-motion photogrammetry derived from video footage of the GWW in Agisoft Metashape (v2.1.1) to reconstruct the GWW community36.
- Video footage (20 videos, total length=4251 s) and photographs (64 images) were collected by scuba divers moving in a boustrophedonic, lawnmower pattern from the deepest section to the top of the wall37. Footage could only be collected in periods of low current38.
- Video footage was segmented at a capture rate of 1 frame/second, yielding a total of 4,348 frames39.
- Blurred, obstructed, and out of focus frames were removed, and the remaining 3,601 frames were imported into Agisoft Metashape40.
- Photos were aligned to form a point cloud, which was then used to produce a 3D model41.
- The model was scaled using spaced laser dots and objects of known size42.
- A 2D orthomosaic (photomap; Fig. 2a) was produced and exported43.
- Individual organisms were outlined and identified on the 2D map to a morphospecies level44.
- The marked-up map was extracted using a custom script in R, resulting in a final digital dataset of the spatial position and morphospecies ID for each specimen45.
In order to investigate if morphospecies were responding to broad-scale background topography, we constructed a digital elevation model (DEM) from the 3D mesh46. We decimated and smoothed the mesh to remove any topography caused by the corals themselves, preserving only the finer 3D topological structure (e.g., shallow caves and crevices)47474747.
Broad ecological patterns on the GWW
To assess broad ecological patterns in the GWW community, we used Berman-Lawson-Waller tests to investigate the relationship between depth and density for all organisms collectively and for morphospecies individually48. These tests compare heterogeneous Poisson models with depth as a predictor against a null model of constant density49. We did not conduct any size-based analyses because Nephtheidae soft corals change size with respect to current, so accurate size measures were not possible50505050.
Univariate spatial analysis of common morphospecies
We investigated the population ecology of the six abundant morphospecies on the GWW by means of univariate spatial point process analyses (SPPA)51. To do this, we used the pair correlation function (PCF) distance measure to investigate model fits between the observed point pattern of each taxon against known spatial patterns52525252. To investigate the effect of depth on population dynamics, we divided our study area into three depth bins: shallow (17-23.5 m), intermediate (23.5-28 m), and deep (28-33.5 m)53. The division was dictated by variation in the topography of the GWW, as the intermediate depth bin contains four shallow caves54.
The simplest spatial pattern is complete spatial randomness (CSR), modelled as a homogeneous Poisson process55. Non-CSR patterns can be aggregated (PCF > 1) or segregated (PCF < 1)56. Aggregation can be caused by habitat associations (modelled by heterogeneous Poisson (HP) processes) or by dispersal-limited reproductive processes (modelled by Thomas cluster (TC) processes)57. Processes combined are best modelled by inhomogeneous Thomas clusters (ITC)58. Segregation can be caused by intraspecific resource competition or density-dependent mortality59.
To test model fits, 9,984 Monte Carlo simulations were run for CSR, TC, HP, and ITC processes60. We then used Diggle’s goodness-of-fit test to quantitatively assess differences between the observed and simulated PCFs, with a high
 value indicating a good model fit61616161.
Fig. 2: a) Orthomosaic of the Great White Wall (GWW); b) Digital elevation model of the GWW; c) specimen map of the GWW. Colour of point indicates morphospecies (lilac=white Nephtheidae, yellow=lemon sponges, light blue=hydroids, dark green=algae, dark blues=scleractinian corals, reds=other soft corals). Scale bars = 5 m. Note that we changed the size of the circles to aid with visibility and so the circles are not to scale62626262.
Results
The mapped GWW community consisted of 25,496 specimens over 377.74
63. The community was dominated by white Nephtheidae (20,978 colonies; 85.82% relative abundance), with an increase in abundance from shallow to deep depth bins64. Hydroids (4.24%), lemon sponges (1.79%), and algae (3.62%) were the other most dominant morphospecies65.
Tubastraea (1.18%) and Dendronephthya (1.06%) were abundant in the shallow depth bin but hardly present at the deeper depth bins66.
Berman-Lawson-Waller tests revealed that the density of all morphospecies together and of each morphospecies individually significantly depended on depth67. No morphospecies exhibited a best fit model to CSR at any depth bin68.
The white Nephtheidae and hydroid populations were best fit by a TC model at smaller spatial scales and an ITC model at larger spatial scales69. For lemon sponges, patterns were best fit by HP and ITC at larger spatial scales and TC at smaller spatial scales in the intermediate and deep bins70. The algae spatial pattern was best fit by an ITC model at the shallow depth bin and a TC and ITC model for intermediate and deep depth bins71. In the shallow depth bin,
Dendronephthya and Tubastraea were best fit by TC models72.
In terms of clustering parameters from best fit TC models, all four abundant morphospecies increased in the density of parent points (?) with depth, but the white Nephtheidae exhibited a disproportionately greater response73. All morphospecies decreased in the mean number of individuals per cluster (µ) with increasing depth74. Likewise, all morphospecies (except for lemon sponges) showed a decrease in cluster radius (?) with increasing depth75.
| Morphospecies | Depth | n | Density (m?²) | Best-fit TC (pd) | Best-fit scale (m) | ? (m) | ? (m?²) | ? (per cluster) |
| Nephtheidae | S | 1,252 | 9.67 | 0.534 | 0.1-1.5 | 0.52 | 0.07 | 145.63 |
| I | 9,304 | 66.46 | 0.654 | 0.3-1.5 | 0.57 | 0.53 | 125.02 | |
| D | 11,165 | 95.17 | 0.348 | 0.1-1.5 | 0.80 | 0.54 | 174.72 | |
| Lemon sponge | S | 288 | 2.22 | 0.505 | 0.3-1.5 | 0.23 | 5.43 | 0.41 |
| I | 96 | 0.67 | 0.801 | 0-0.3 | 0.07 | 1.27 | 0.53 | |
| D | 107 | 0.91 | 0.985 | 0-0.3 | 0.06 | 2.68 | 0.41 | |
| Hydroid | S | 176 | 1.36 | 0.609 | 0.3-1.5 | 0.29 | 0.19 | 7.05 |
| I | 343 | 2.45 | 0.234 | 0-0.2 | 0.05 | 0.66 | 3.73 | |
| D | 647 | 5.52 | 0.413 | 0-0.1 | 0.03 | 2.03 | 2.72 | |
| Algae | S | 145 | 2.34 | 0.875 | 0-1.50 | 0.14 | 0.06 | 18.99 |
| I | 474 | 1.12 | 0.339 | 0-0.3 | 0.01 | 0.31 | 10.86 | |
| D | 347 | 3.39 | 0.258 | 0-0.1 | 0.04 | 1.04 | 2.84 | |
| Tubastraea | S | 129 | 1.00 | 0.330 | 0-1.5 | 0.19 | 0.44 | 2.28 |
| Dendronephthya | S | 164 | 1.27 | 0.917 | 0-0.3 | 0.06 | 2.41 | 0.53 |
Table 1: Summary of univariate PCF analyses for abundant morphospecies on the Great White Wall. S=shallow, I=intermediate, D=deep.76
Discussion
Both the white Nephtheidae and hydroid populations were well fit by TC and ITC models at all depths, reflecting the shared importance of reproductive processes and the local environment for these morphospecies77. These best-fit models likely reflect the influence of combined reproductive and feeding dynamics78. It is likely that the abundance of filter feeders on the GWW capitalises on an abundance of food from nutrient-rich water flowing over the wall79. Lemon sponge spatial patterns were also fit well by reproductive models with habitat associations (ITC), but habitat preferences were much more important where food was scarcer in the shallows80.
Algae were best fit by reproductive (TC) models at all depth bins, likely reflecting more plentiful light in the shallows, whereas wall topography and water depth created an impediment to light access at greater depths81818181.
Tubastraea and Dendronephthya spatial patterns were best modelled by reproductive processes (TC), but these morphospecies were only plentiful in the shallow bin82. This could be reflective of competition for space precluding larger morphospecies with slower growth rates at greater depths where overall density is higher83.
The white Nephtheidae were the dominant filter feeders on the GWW84. In other locations where soft corals show local dominance, reproductive lability, fast growth rates, and higher competitive ability have been suggested as mechanisms of dominance85. On the GWW, we observed fission and budding reproductive modes from photographs86. The capacity for Nephtheidae to grow quickly and reproduce using a variety of strategies, regular nutrient influx, and a potentially high disturbance regime are likely the combined contributors to their local dominance on the GWW87.
Despite the dominance displayed by the white Nephtheidae, substantial populations of other filter feeders were still able to coexist88. One possible explanation is that Nephtheidae soft corals have a temporal feeding niche—they actively filter feed at times of high current, but otherwise retract their polyps89. This would permit other filter-feeding taxa to feed at times of low current when the dominant white Nephtheidae are not feeding90. Partitioning of time as an ecological resource has been observed in other systems and may be a mechanism for increasing invertebrate biodiversity on some soft coral-dominated reefs91.
References
Note: The provided document does not include a full reference list. The following works were cited in the text, but their complete bibliographic information is not available in the source PDF.
- Winkler et al. (1999)
- Atwood et al. (2018)
- Baddeley (2015)
- Baddeley (2024)
- Baddeley and Turner (2000)
- Bastidas et al. (2004)
- Benayahu and Loya (1977)
- Berman (1986)
- Brown et al. (2011)
- Coffroth et al. (2023)
- Connell (1970)
- Conte et al. (2020)
- Corry et al. (2018)
- Costanza et al. (2014)
- Delahooke et al. (2024)
- Diggle (2003)
- Diggle and Gratton (1984)
- Edmunds and Lasker (2022)
- Epstein and Kingsford (2019)
- Evans (2023)
- Fabricius (1995)
- Fabricius and Alderslade (2001)
- Fedriani et al. (2010)
- Fox et al. (2003)
- Gibbs and Hay (2015)
- Gori et al. (2011)
- Graham et al. (2013)
- Gray and He (2009)
- Hellström and Benzie (2011)
- Hu et al. (2020)
- Hughes et al. (2017, 2018)
- Hwang and Song (2007)
- Illian et al. (2008)
- Inoue et al. (2013)
- Jacquemyn et al. (2010)
- Jácome-Flores et al. (2016)
- Janzen (1970)
- Kikuzawa et al. (2020)
- Kronfeld-Schor and Dayan (2003)
- Lalas et al. (2023)
- Lalas et al. (2024)
- Larkin et al. (2021)
- Larkin et al. (2023)
- Larkin et al. (2024)
- Lasker et al. (2020)
- Lawson (1993)
- Lesser (2006)
- Lesser et al. (2021)
- Lolis et al. (2023)
- Loosmore and Ford (2006)
- Lopes et al. (2018)
- López-Londoño et al. (2022)
- Madin et al. (2018)
- Maucieri and Baum (2021)
- May et al. (2015)
- McClanahan and Obura (1997)
- McFadden et al. (2019)
- McFadden et al. (2022)
- Mitchell and Harris (2020)
- Mitchell et al. (2015)
- Mitchell et al. (2019)
- Mitchell et al. (2020)
- Muko et al. (2014)
- Otis et al. (2024)
- Perkol-Finkel and Benayahu (2004)
- Prado et al. (2019)
- Putnam et al. (2017)
- R Core Team (2023)
- Raventós et al. (2010)
- Reimer et al. (2024)
- Richardson et al. (2023)
- Roberts et al. (2002)
- Roff and Mumby (2012)
- Ruzicka et al. (2013)
- Sammarco (1985)
- Shen et al. (2009)
- Shlesinger et al. (2024)
- Thomas (1949)
- Toledo-Rodriguez et al. (2025)
- Velázquez et al. (2016)
- Waller et al. (1992)
- Wiegand (2018)
- Wiegand and Moloney (2014)
Coral Reefs – https://doi.org/10.1007/s00338-025-02712-y
- July 2025
- Coral Reefs
- DOI:10.1007/s00338-025-02712-y
- License
- CC BY 4.0
You must be logged in to post a comment.